部署 AWS 监控解决方案
最近更新时间:2023.09.26 16:27:20
首次发布时间:2022.09.08 14:11:19
本文档介绍如何在 AWS 中部署监控解决方案(monitoring solution)并获取监控操作的 API endpoint 和 API Key。
背景
在多云CDN服务中,如果您的纳管账号的云厂商是 AWS,多云CDN服务默认无法获取纳管的 distributions 的统计数据。例如,多云CDN服务无法获得纳管域名的流量数据。
要使多云CDN服务获取纳管的 distributions 的统计数据,您需要执行以下操作:
- 在 AWS 管理控制台中部署 AWS 监控解决方案。
- 部署后,获取监控操作的 API endpoint 和 API Key。
- 在纳管账号的统计分析设置中输入 API endpoint 和 API Key。
- 在 CloudFront 管理控制台,对纳管的 distributions 开启实时日志的功能。
- 在多云CDN控制台,对纳管账号启用统计分析。
以上步骤的详细说明如下。
注意
部署 AWS 监控解决方案会使您的 AWS 账户产生消费记录。在继续以下操作前,请咨询您的 AWS 商务代表。
步骤 1:部署 AWS 监控解决方案
您使用 AWS CloudFormation 模板来部署 AWS 监控解决方案。
- 打开 AWS CloudFormation 管理控制台。
- 在页面上,点击 Create stack。
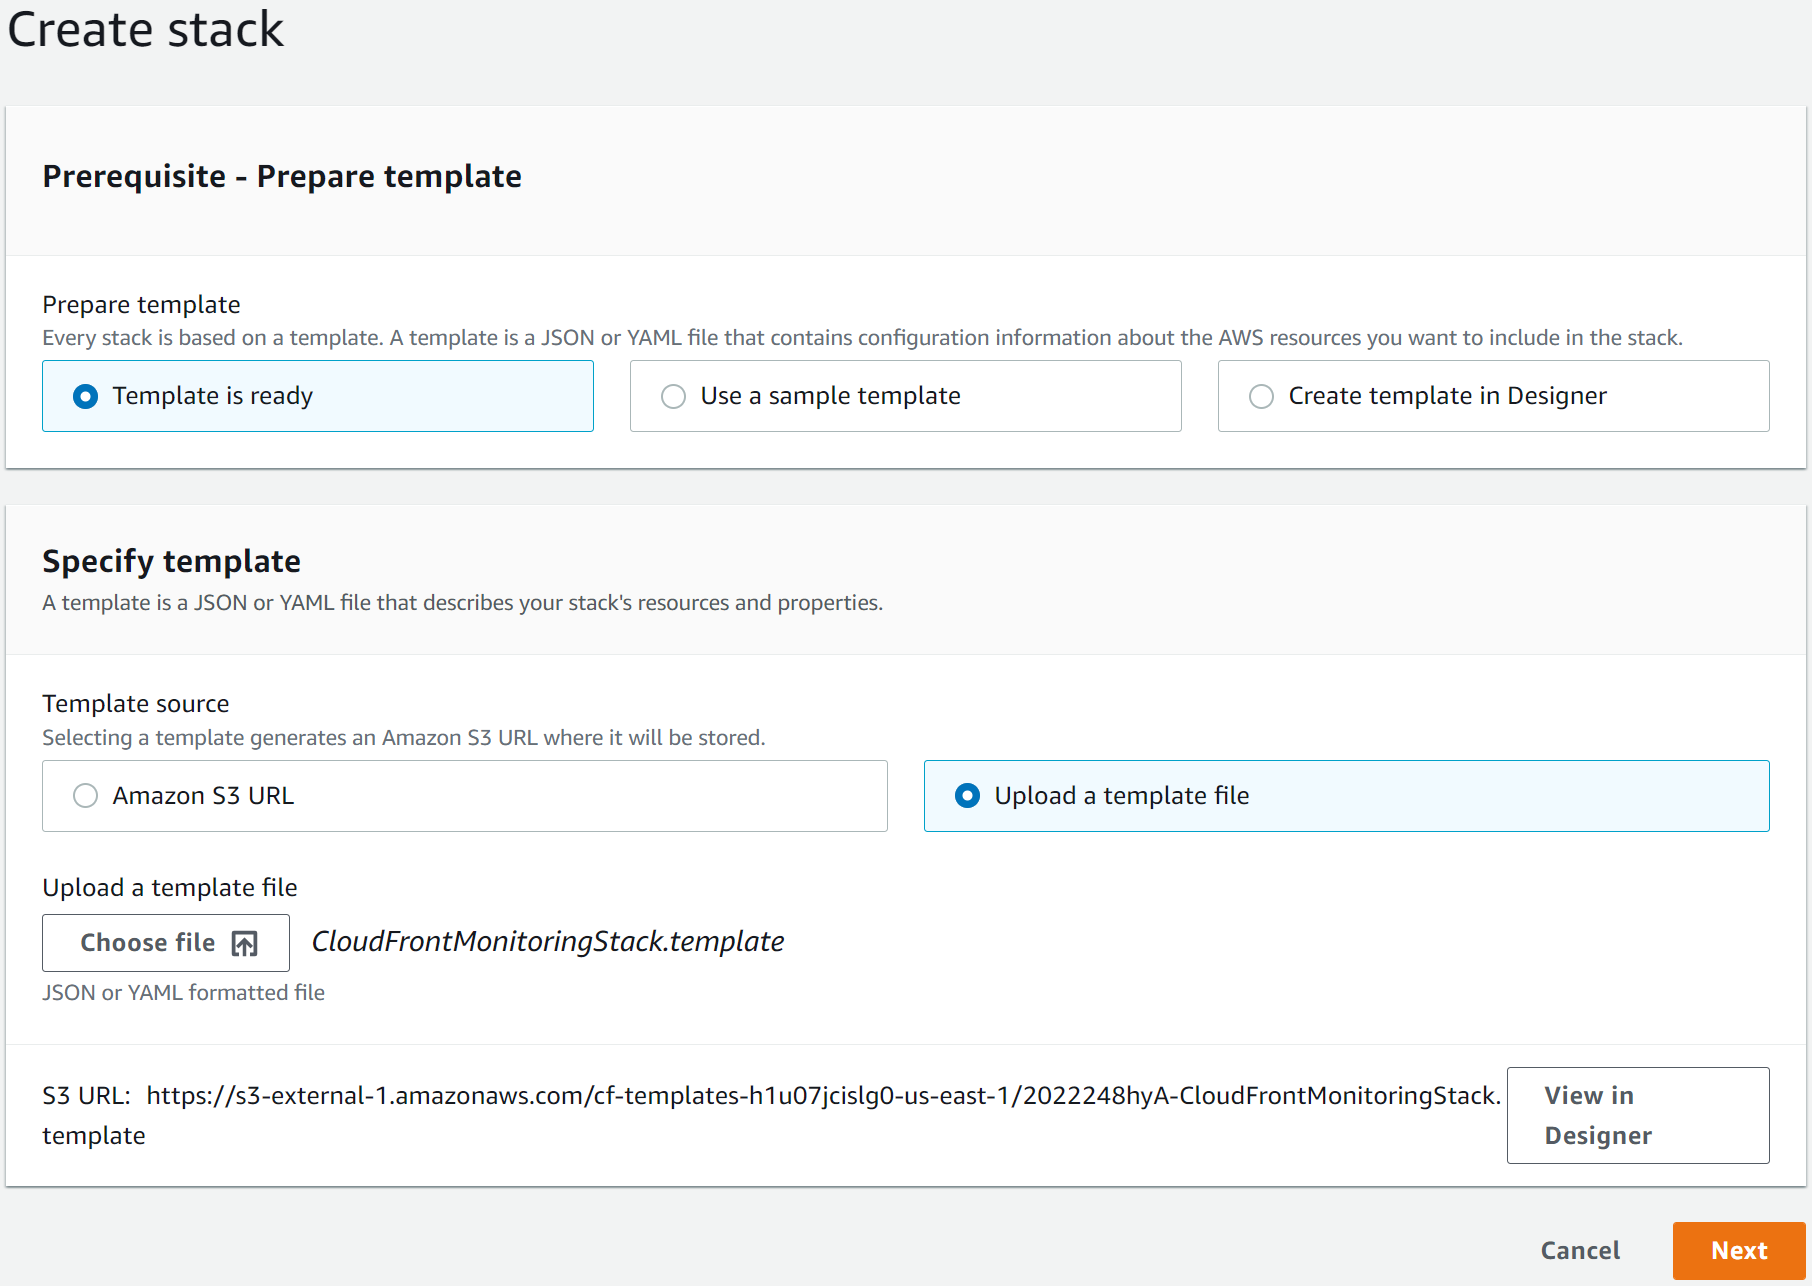
- 在 Create stack 页面的 Prerequisite - Prepare template 下方,选择 Template is ready。
- 下载以下文件到本地。


- 在 Specify template 下方,选择 Upload a template file。
- 点击 Choose file 上传该文件,然后点击 Next。
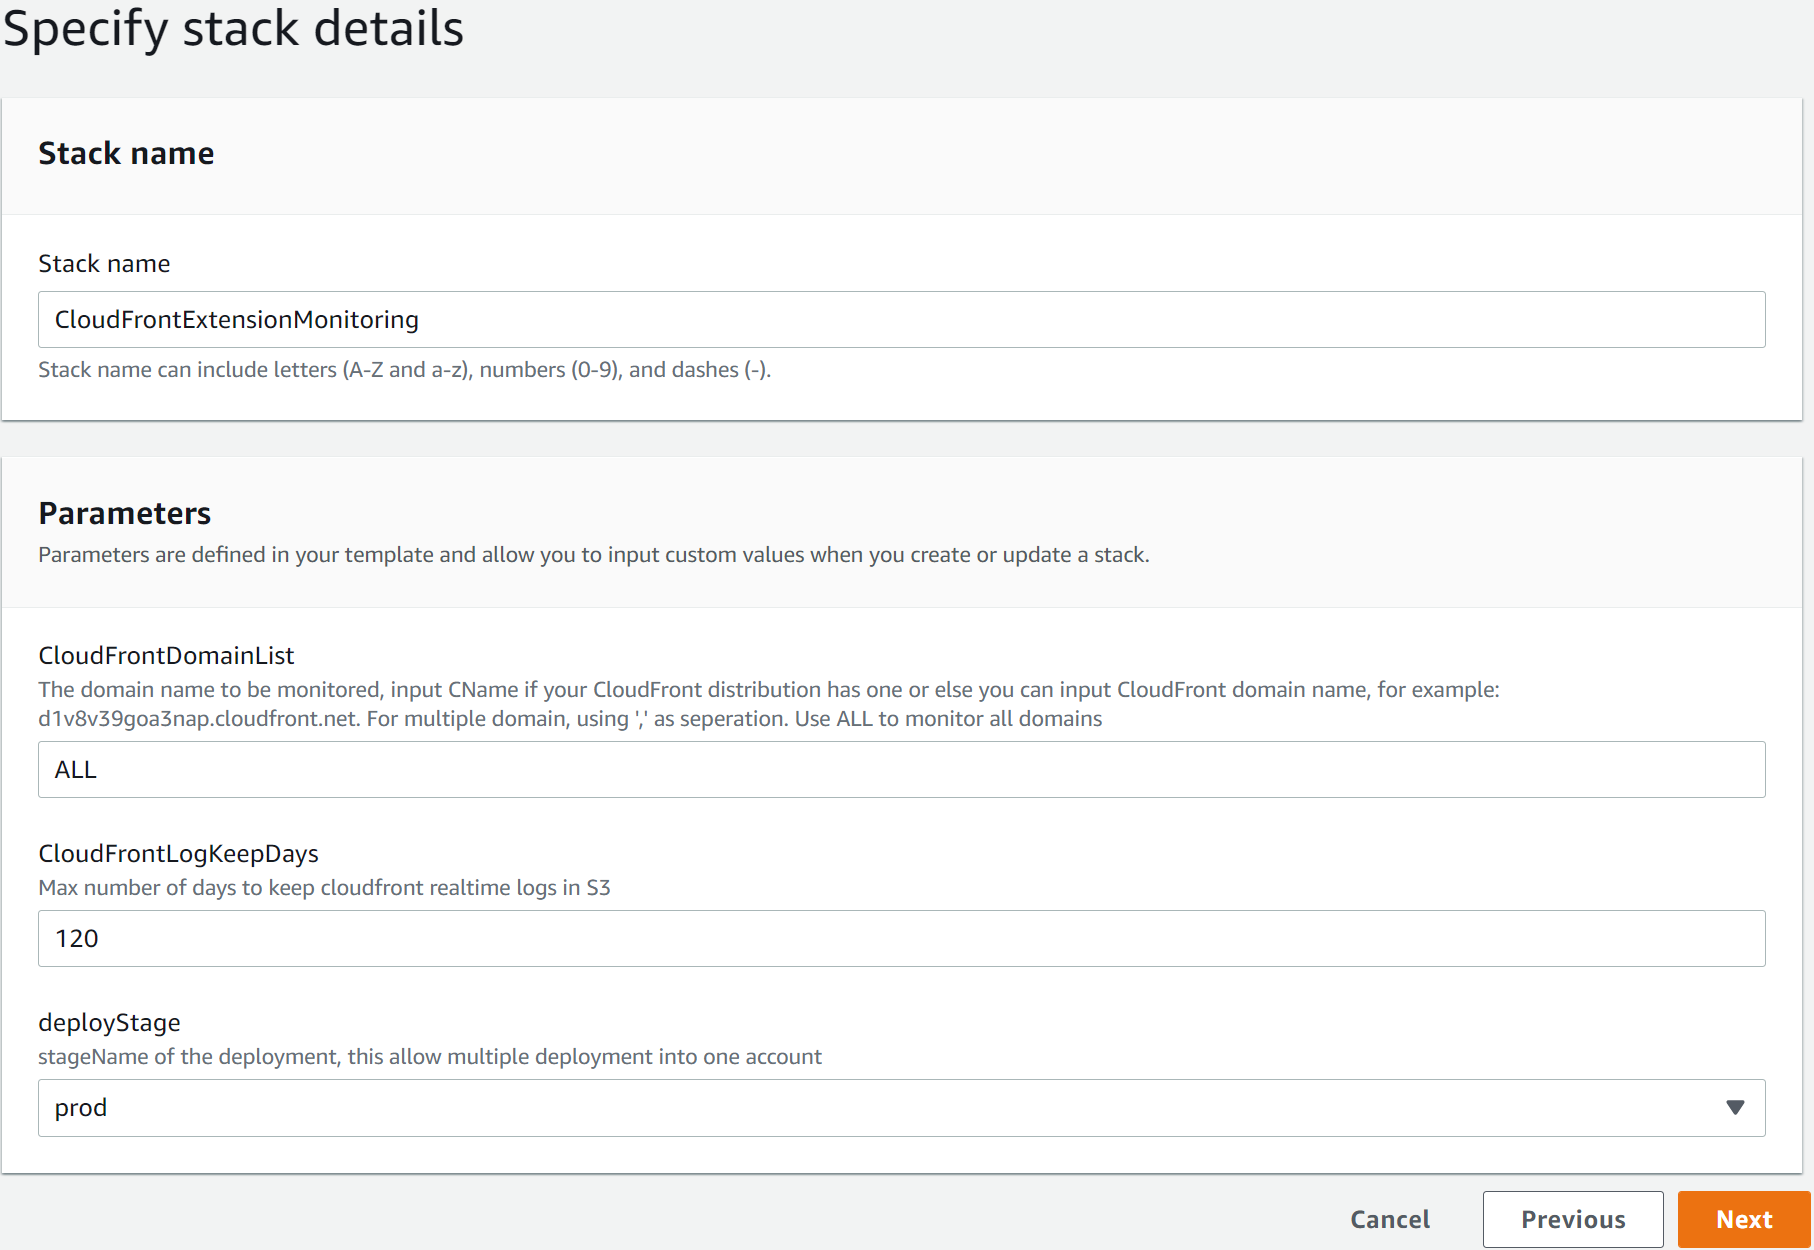
- 在 Specify stack details 页面,设置以下内容:
- 输入一个 stack name。假设您输入的 stack name 是
CloudFrontExtensionMonitoring。 - 在 CloudFrontDomainList 处,输入
ALL。ALL 指定您的所有 distriubtions 都开启监控。
- 输入一个 stack name。假设您输入的 stack name 是
- 点击 Next。
- 在 Configure stack options 页面,可以不配置任何内容,点击 Next。
- 在 Review 页面最下方,勾选以下选项:
- I acknowledge that AWS CloudFormation might create IAM resources.
- 点击 Create stack。
此时,AWS 管理控制台就开始创建 stack 了。您可以点击页面左侧的 Stacks 面板中的刷新按钮来查看创建的进度。每次刷新后,留意 CloudFrontExtensionMonitoring 的状态。如果状态变成了 CREATE_COMPLETE,stack 就创建成功了。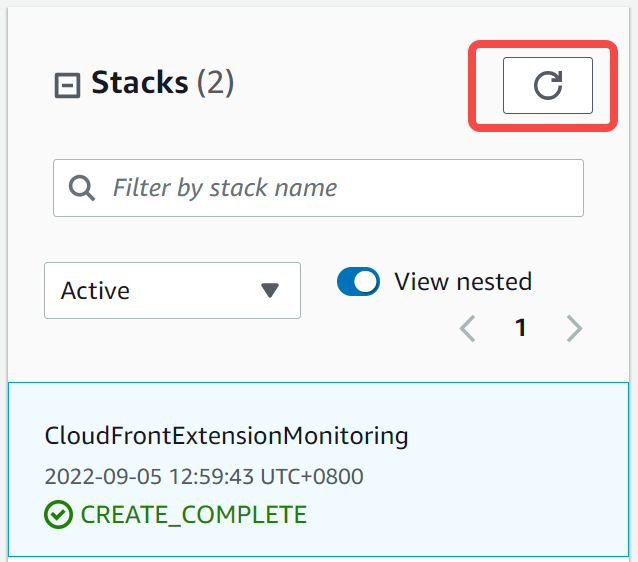
步骤 2:获取监控操作的 API endpoint
- stack 创建后,点击 Outputs 标签页。
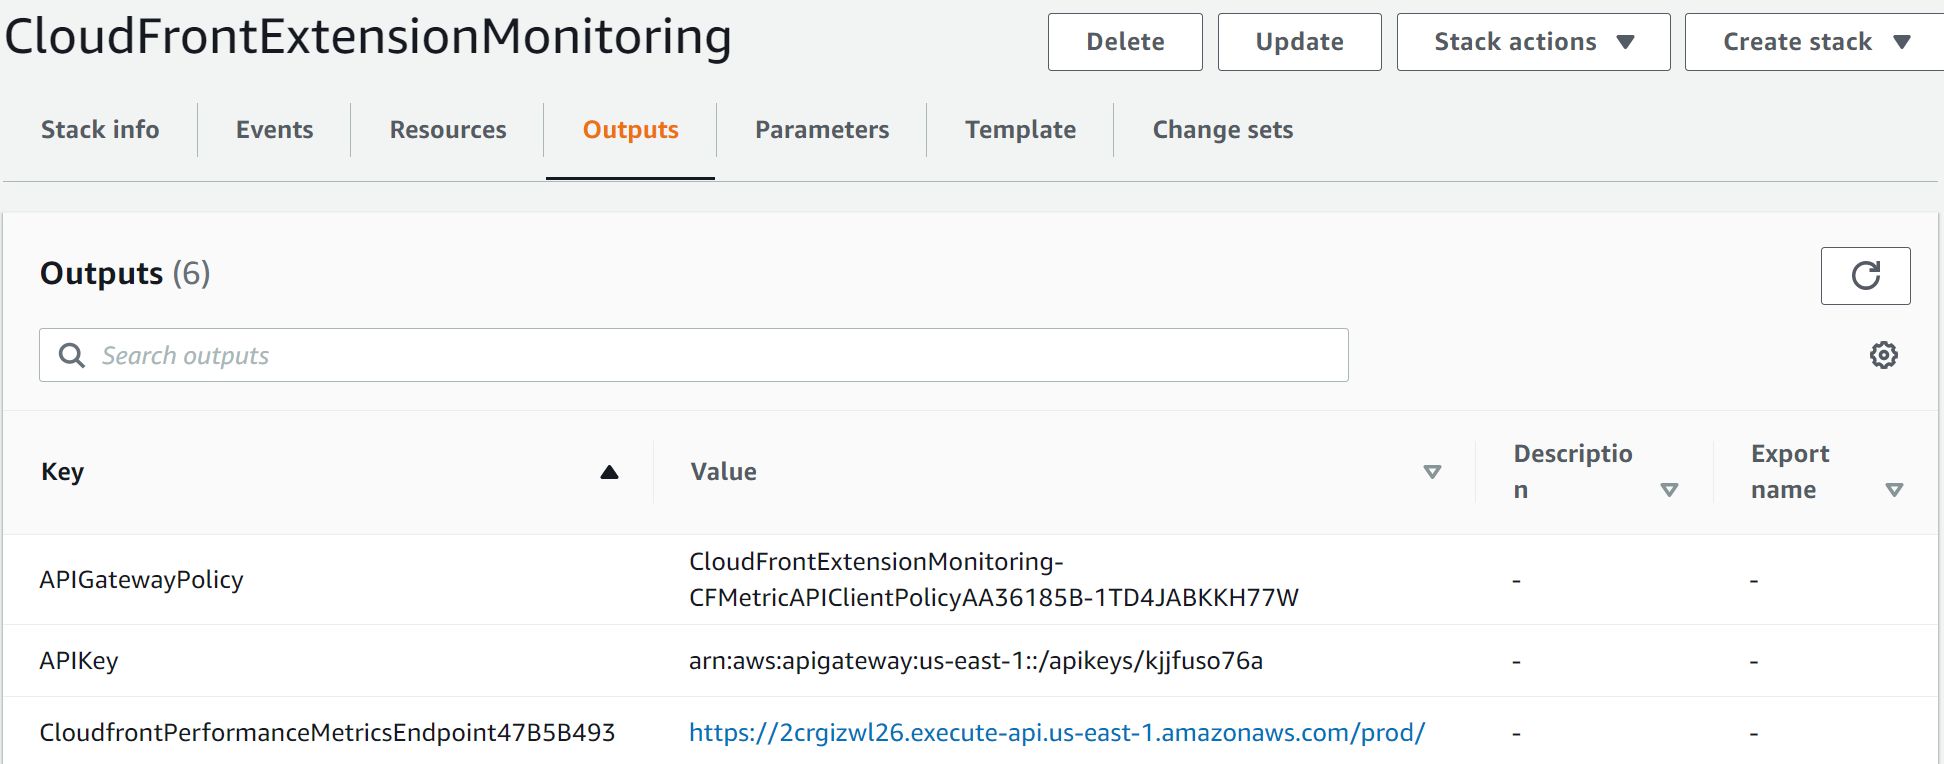
- 记录以下资源的值:
- CloudfrontPerformanceMetricsEndpoint:表示获取 distributions 的统计数据所使用的 API endpoint。
- APIKey:该 APIKey 不是您需要的 API KEY。但是请留意该资源的 ID。截图中,该 ID 是
kjjfuso76a。
步骤 3:获取监控操作的 API Key
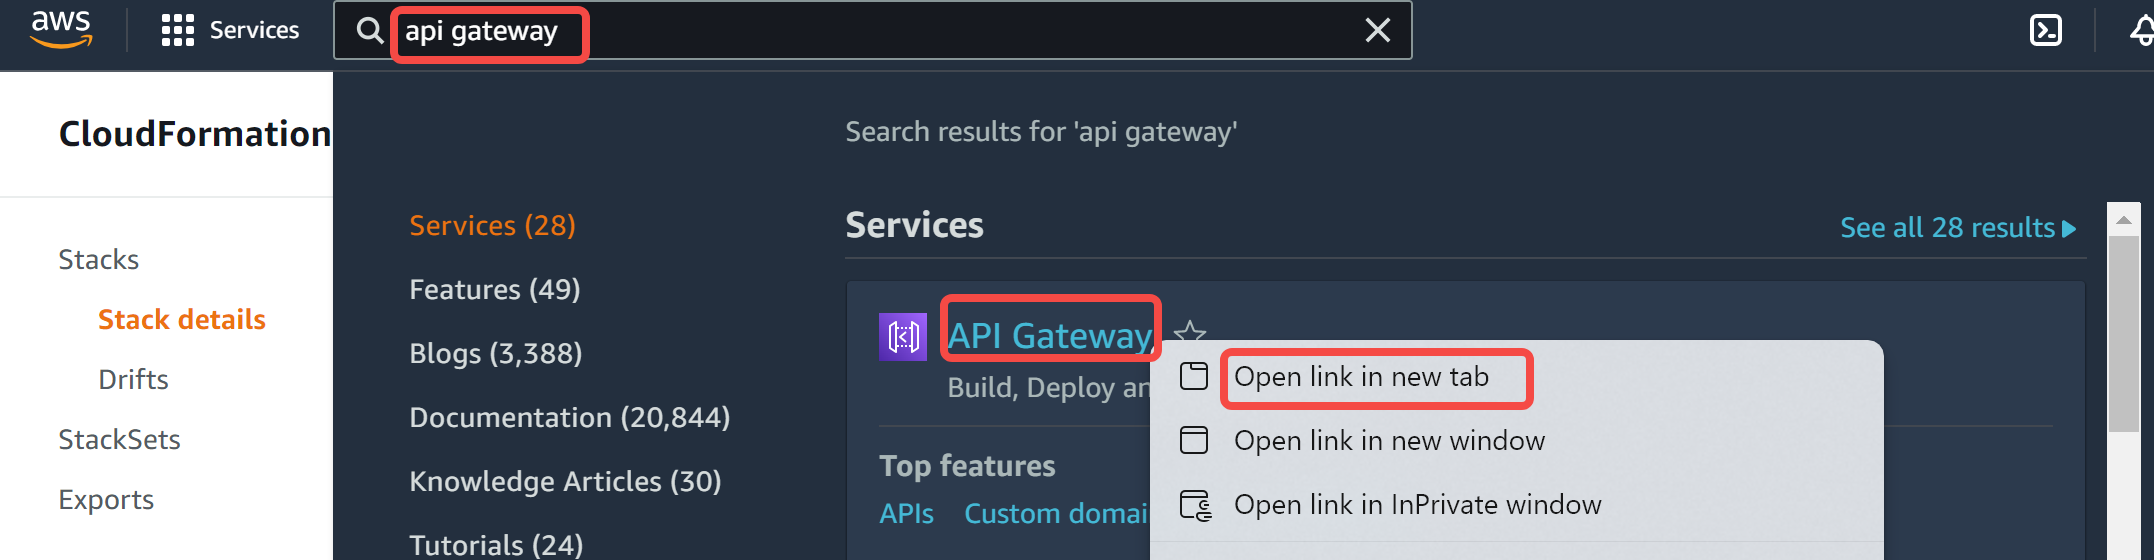
- 在页面最上方的搜索框中输入
api gateway,然后在搜索结果中右键点击 API Gateway,然后点击 Open Link in new tab。
- 在 API Gateway 管理控制台,点击 CloudfrontPerformanceMetrics。
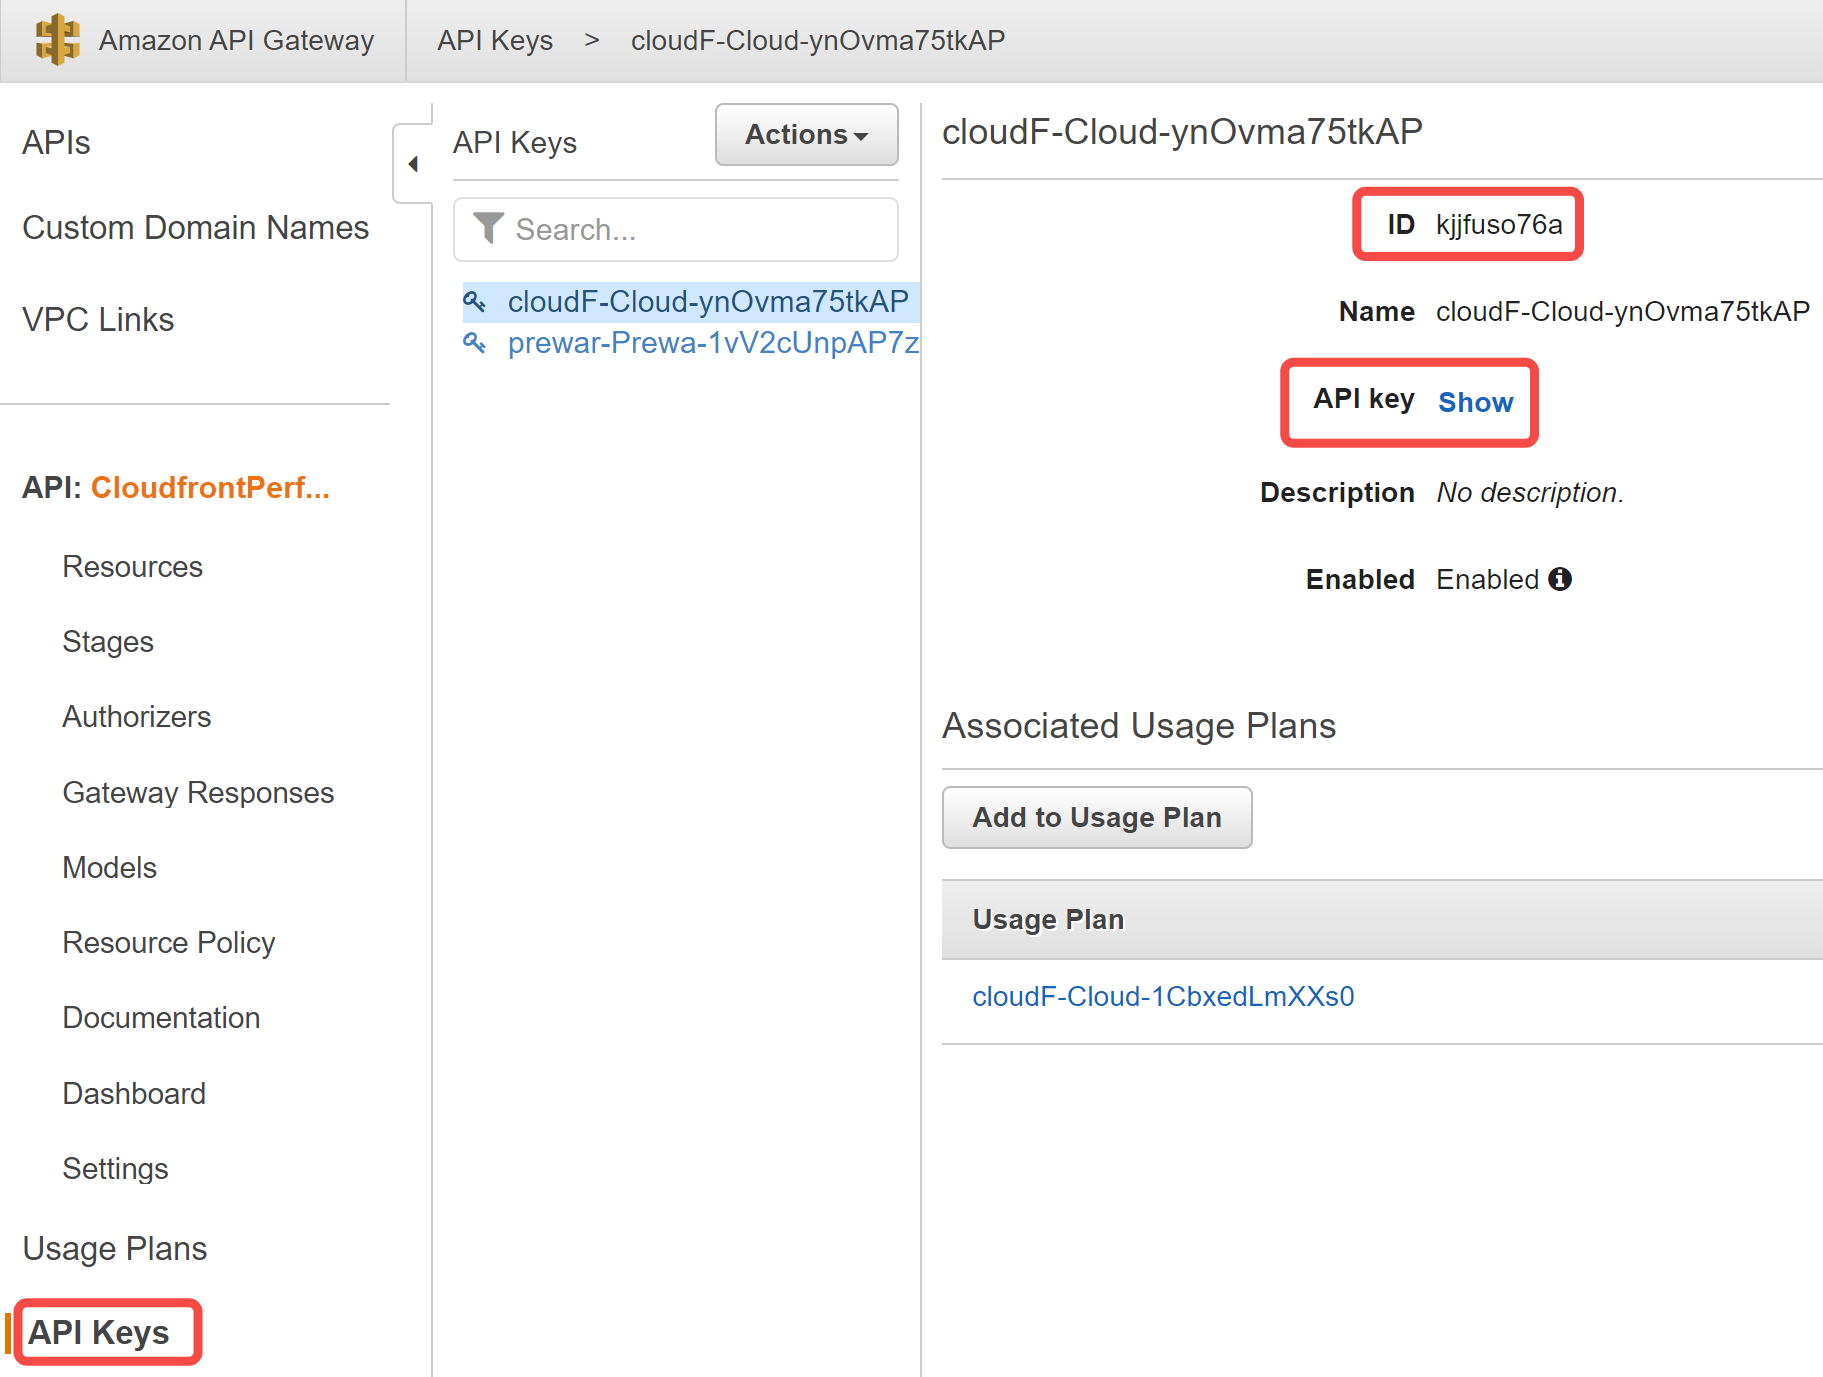
- 在左侧导航栏,点击 API Keys。
- 在页面的中间区域,点击您的 API Key。
- 在 API Key 详情区域,留意 ID 是否和 APIKey 的 ID 相同。
- 在 API key 右边,点击 Show。
- 记录 API key 的值。
步骤 4:对纳管的 distributions 开启实时日志的功能
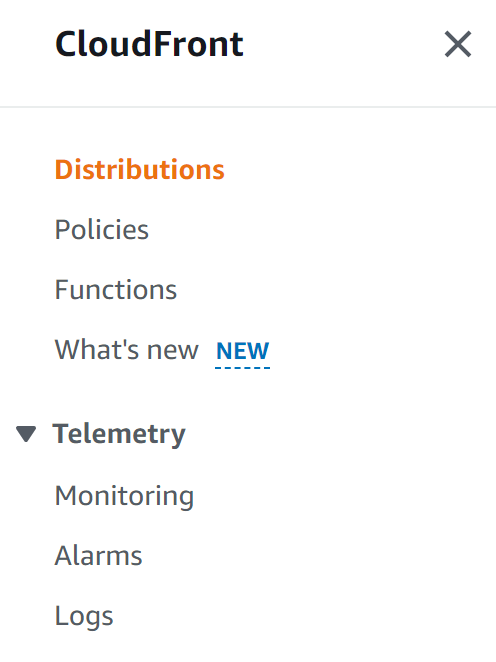
打开 CloudFront 管理控制台。
在左侧导航栏的 Telemetry 下面,点击 Logs。
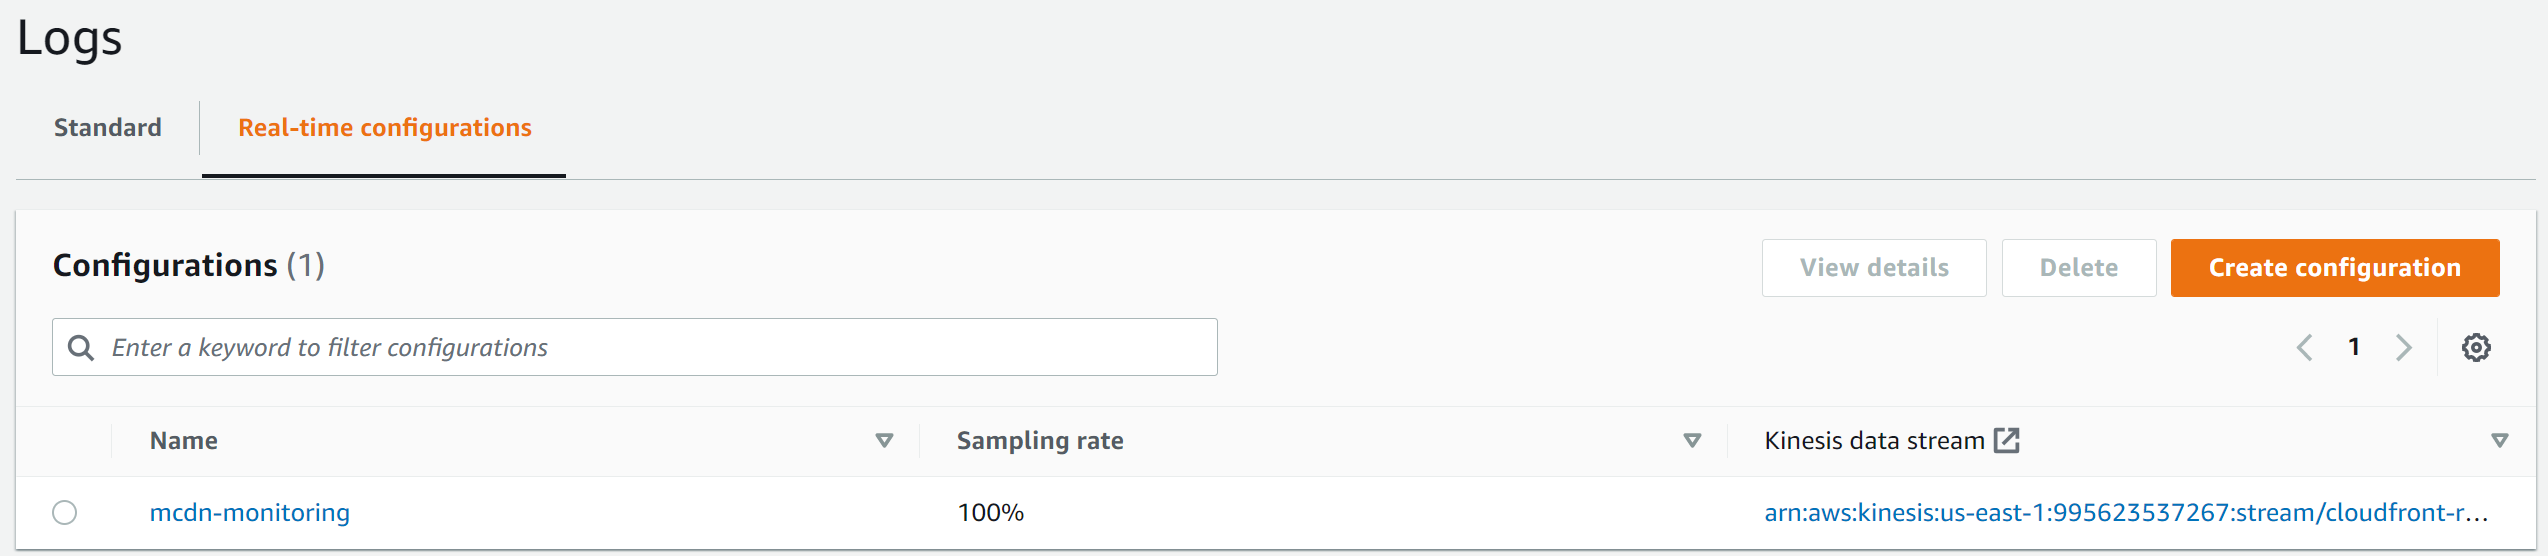
在 Logs 页面,点击 Real-time configurations 标签页。
在 Real-time configurations 标签页上,点击 Create configuration。
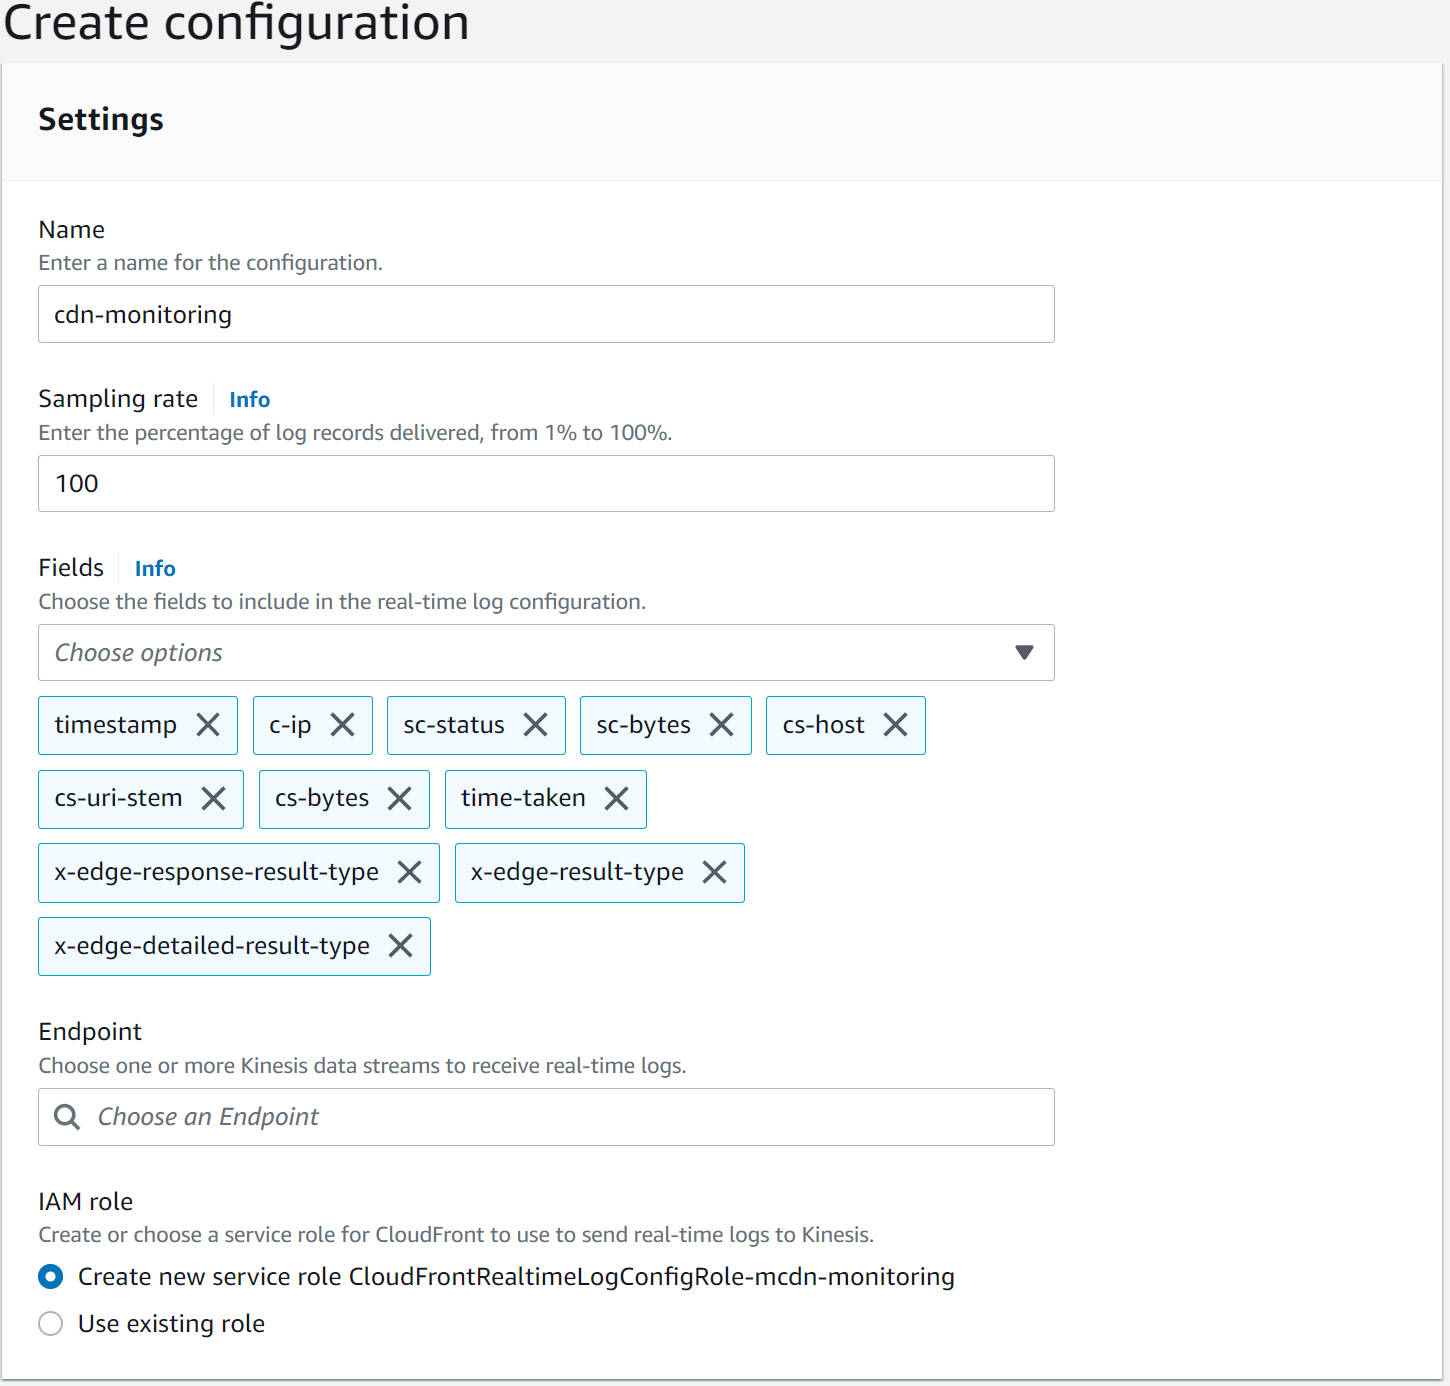
在 Create configuration 页面,配置以下设置:
- 输入一个名称。例如,您输入
cdn-monitoring。 - 设置 Sampling rate 为 100。
- 设置 Endpoint 为下拉列表中的一个 Kinesis data stream。
在您部署监控解决方案时,系统会创建一个 Kinesis data stream。 - 在 Fields 列表中,勾选以下字段。多云CDN服务需要这些字段来获取域名的使用数据。
- timestamp
- c-ip
- sc-status
- sc-bytes
- cs-host
- cs-uri-stem
- cs-bytes
- time-taken
- x-edge-response-result-type
- x-edge-result-type
- x-edge-detailed-result-type
- 输入一个名称。例如,您输入
点击 Create configuration。
configuration 创建完成后,您需要指定该 configuration 所关联的 distributions。
- 在 Logs 页面,点击 Real-time configurations。
- 在 Name 列,点击刚创建的 configuration。
- 在 Attached distributions 下方,点击 Attach to distribution。
- 在 Distribution 列表中,选择一个您的 distribution,然后点击 Attach。
- 如果您有其他的 distributions 需要关联,重复上一个步骤。
在您关联 distribution 后,您可以在 Logs 页面点击 Standard 标签页。在 Distributions 列表中,您的 distribution 的 Real-time logs 列的值是 Enabled。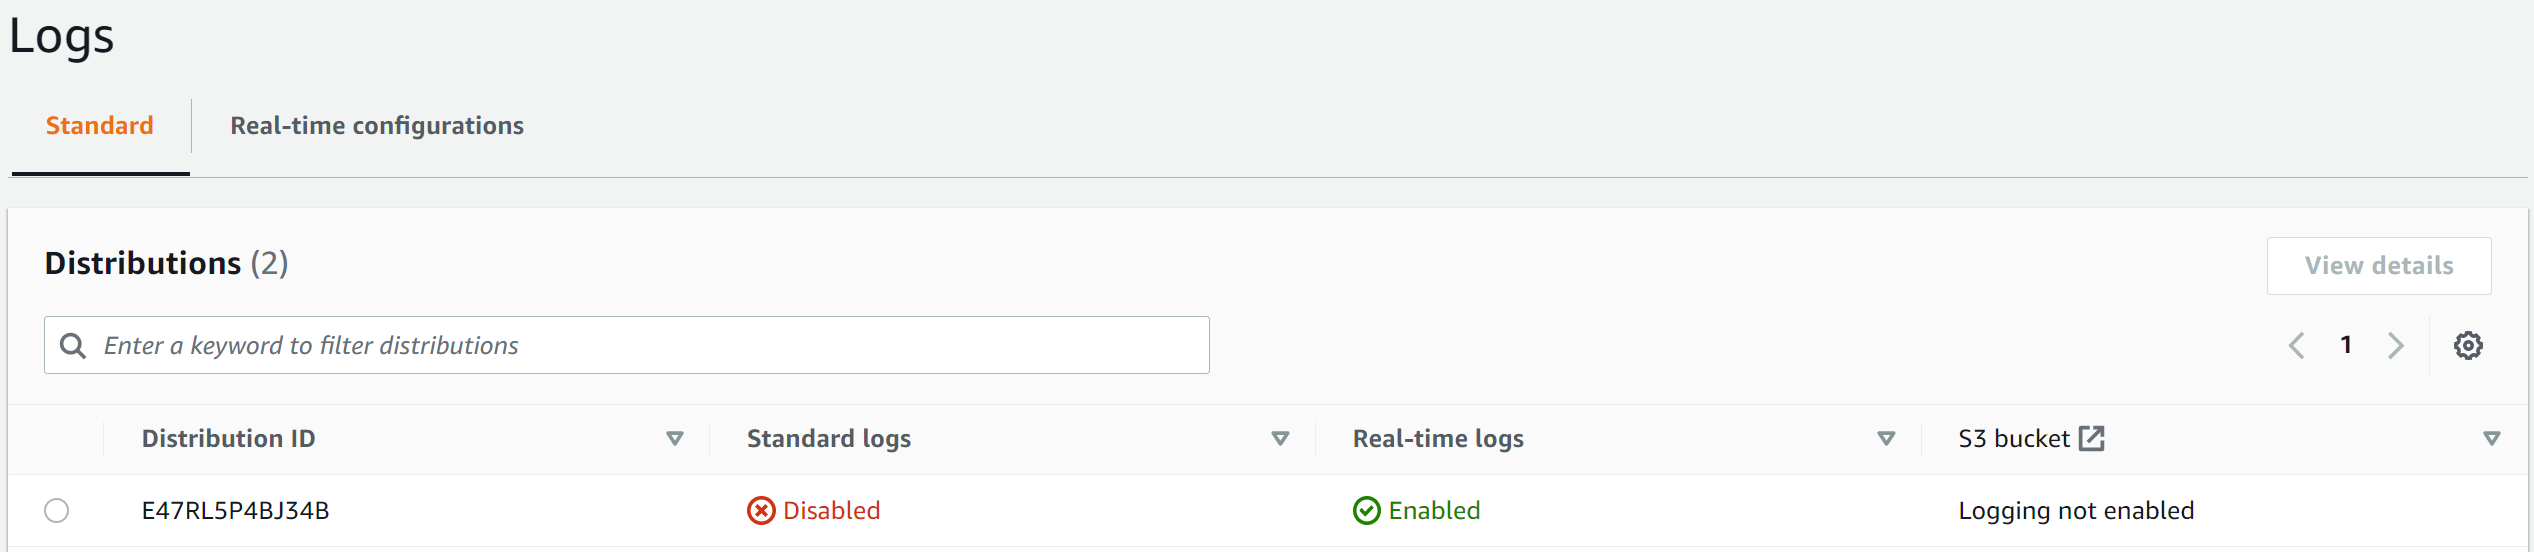
注意
如果您未关联某个 distribution,同时该 distribution 是纳管域名,多云CDN服务将无法获取该 distribution 的的统计数据。此时,在多云CDN控制台的统计分析页面,该 distribution 的统计数据都会是 0。
步骤 5:对纳管账号启用统计分析
参见数据同步。