托管 Prometheus
托管 Prometheus


文档指南

请输入


- 文档首页
 托管 Prometheus最佳实践使用托管 Prometheus 监控 ECS 实例
使用托管 Prometheus 监控 ECS 实例
托管 Prometheus 服务支持监控云服务器(ECS)实例,获取云服务器的指标信息。本文为您介绍如何配置云服务器(ECS)实例监控。
前提条件
操作步骤
步骤一:检查安全组
为了保证您能够使用部署在 VKE 集群中的采集器,正确采集到相同 VPC 内的其他 ECS 的监控数据,您需要首先检查 VPC 安全组的配置。步骤如下:
- 登录 私有网络控制台。
- 在左侧导航栏中选择 安全组。
- 在安全组列表中选择需要检查的安全组。单击 安全组名称,进入安全组详情。
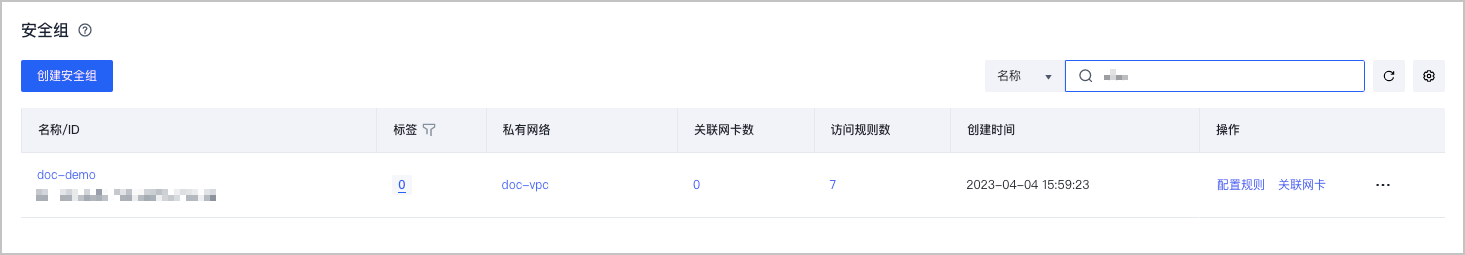
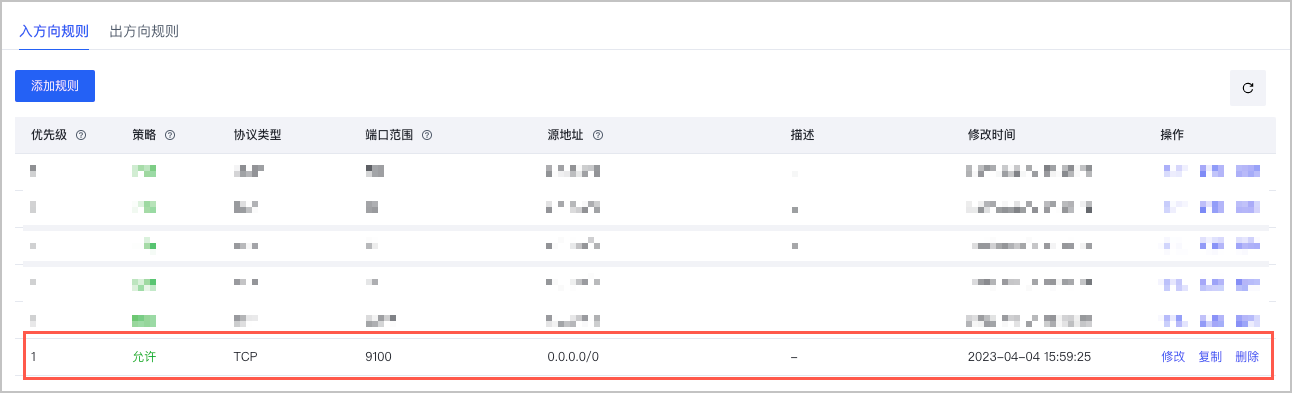
- 选择 访问规则 页签,确认访问组的 入方向规则 和 出方向规则 中,已经添加了对应 Exporter 的端口。在本例中,需要在 入方向规则 中添加 TCP 9100 端口。
步骤二:下载并配置 node-exporter
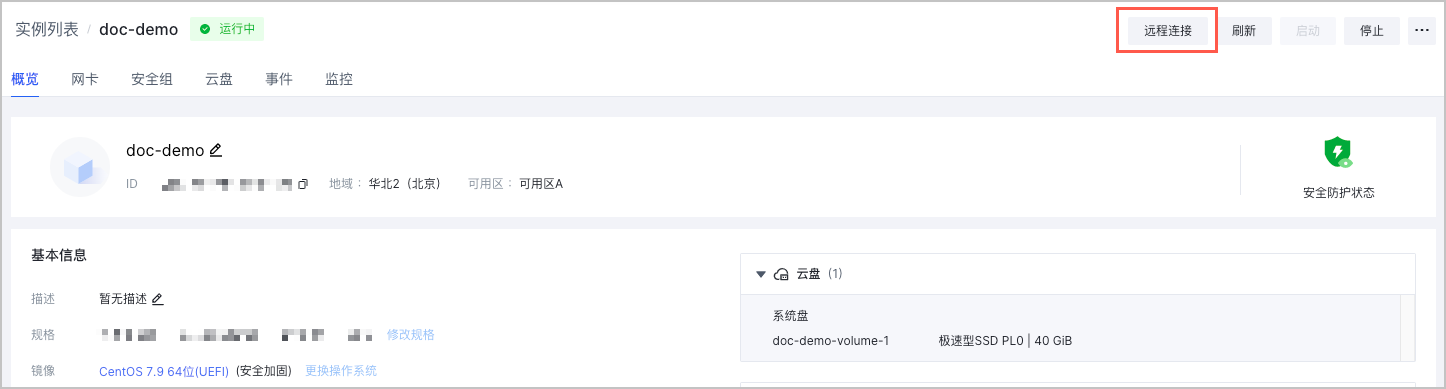
- 登录 云服务器控制台。
- 在左侧菜单栏中选择 实例与镜像 > 实例,进入目标云服务器的控制台。
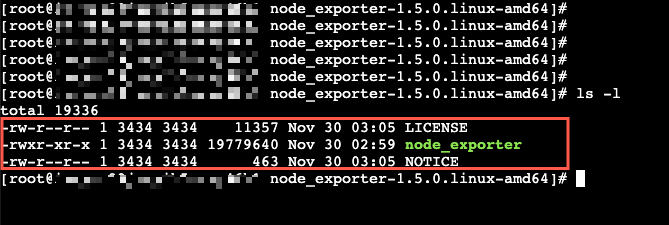
- 执行以下命令,下载 node-exporter 并解压。
wget https://github.com/prometheus/node_exporter/releases/download/v1.5.0/node_exporter-1.5.0.linux-amd64.tar.gz && tar -xvf node_exporter-1.5.0.linux-amd64.tar.gz
说明
如果您无法在 ECS 云服务器中下载 exporter,可以尝试在本地主机中下载并上传至 ECS 云服务器。详情请参见 本地 Linux 或 macOS 系统通过 SCP 上传文件到 Linux 云服务器。
- 进入解压后的文件夹,执行以下命令,启动 node-exporter。
nohup ./node_exporter &
- 执行以下命令,查看 node-exporter 暴露的指标,确认其是否工作正常。
curl http://127.0.0.1:9100/metrics
说明
- 请根据实际情况替换命令中的端口。
- 建议在 Prometheus-agent 所在节点上也进行连通性测试(例如:在节点上执行
curl http://ecs-ip:9100/metrics),检查连接是否通畅,避免由于被安全组限制,导致无法正确抓取到指标数据。
如果 node-exporter 工作正常,预期能够获得以下返回结果。
# HELP go_gc_duration_seconds A summary of the pause duration of garbage collection cycles.
# TYPE go_gc_duration_seconds summary
go_gc_duration_seconds{quantile="0"} 0
go_gc_duration_seconds{quantile="0.25"} 0
go_gc_duration_seconds{quantile="0.5"} 0
go_gc_duration_seconds{quantile="0.75"} 0
go_gc_duration_seconds{quantile="1"} 0
go_gc_duration_seconds_sum 0
go_gc_duration_seconds_count 0
# HELP go_goroutines Number of goroutines that currently exist.
# TYPE go_goroutines gauge
go_goroutines 7
# HELP go_info Information about the Go environment.
# TYPE go_info gauge
go_info{version="go1.19.3"} 1
# HELP go_memstats_alloc_bytes Number of bytes allocated and still in use.
# TYPE go_memstats_alloc_bytes gauge
go_memstats_alloc_bytes 2.626832e+06
# HELP go_memstats_alloc_bytes_total Total number of bytes allocated, even if freed.
# TYPE go_memstats_alloc_bytes_total counter
go_memstats_alloc_bytes_total 2.626832e+06
# HELP go_memstats_buck_hash_sys_bytes Number of bytes used by the profiling bucket hash table.
# TYPE go_memstats_buck_hash_sys_bytes gauge
go_memstats_buck_hash_sys_bytes 1.447059e+06
# HELP go_memstats_frees_total Total number of frees.
# TYPE go_memstats_frees_total counter
go_memstats_frees_total 2055
......
步骤三:配置服务发现
- 登录 容器服务控制台。
- 单击左侧导航栏中的 集群。
- 在集群列表页面,单击目标集群,进入集群管理页面。
- 在左侧菜单栏中选择 工作负载 > 对象浏览器。 单击 使用 Yaml 创建 ,配置服务发现。
- 在 类型 下拉菜单中选择 自定义。
- 在 Yaml 配置框内输入 Yaml 配置。
apiVersion: operator.victoriametrics.com/v1beta1
kind: VMStaticScrape
metadata:
  name: ecs # 配置服务发现规则的名称
  namespace: default # 配置服务发现所在的命名空间,指定存在的任意命名空间即可
  labels:
    volcengine.vmp: "true" # 配置服务发现规则的标签,允许被 Prometheus-agent 发现
spec:
  jobName: "ecs"
  targetEndpoints:
    - targets: ["192.168.1.9:9100"] # 指定 ECS 云服务器的私网 IP 地址和端口号
      path: "metrics" # 填写指标暴露的 URI 路径,不填默认为 /metrics
- 单击 确定,完成配置。
说明
更多服务发现配置的相关说明,请参见 官方文档。
查看结果
您可以使用托管 Prometheus 服务的 Explore 功能来查看监控指标数据。详情请参见 指标查询。
如果托管 Prometheus 接入了自建的 Grafana,也可以通过 Grafana 查看监控数据。详情请参见 在容器服务集群中部署 Grafana 并接入工作区。
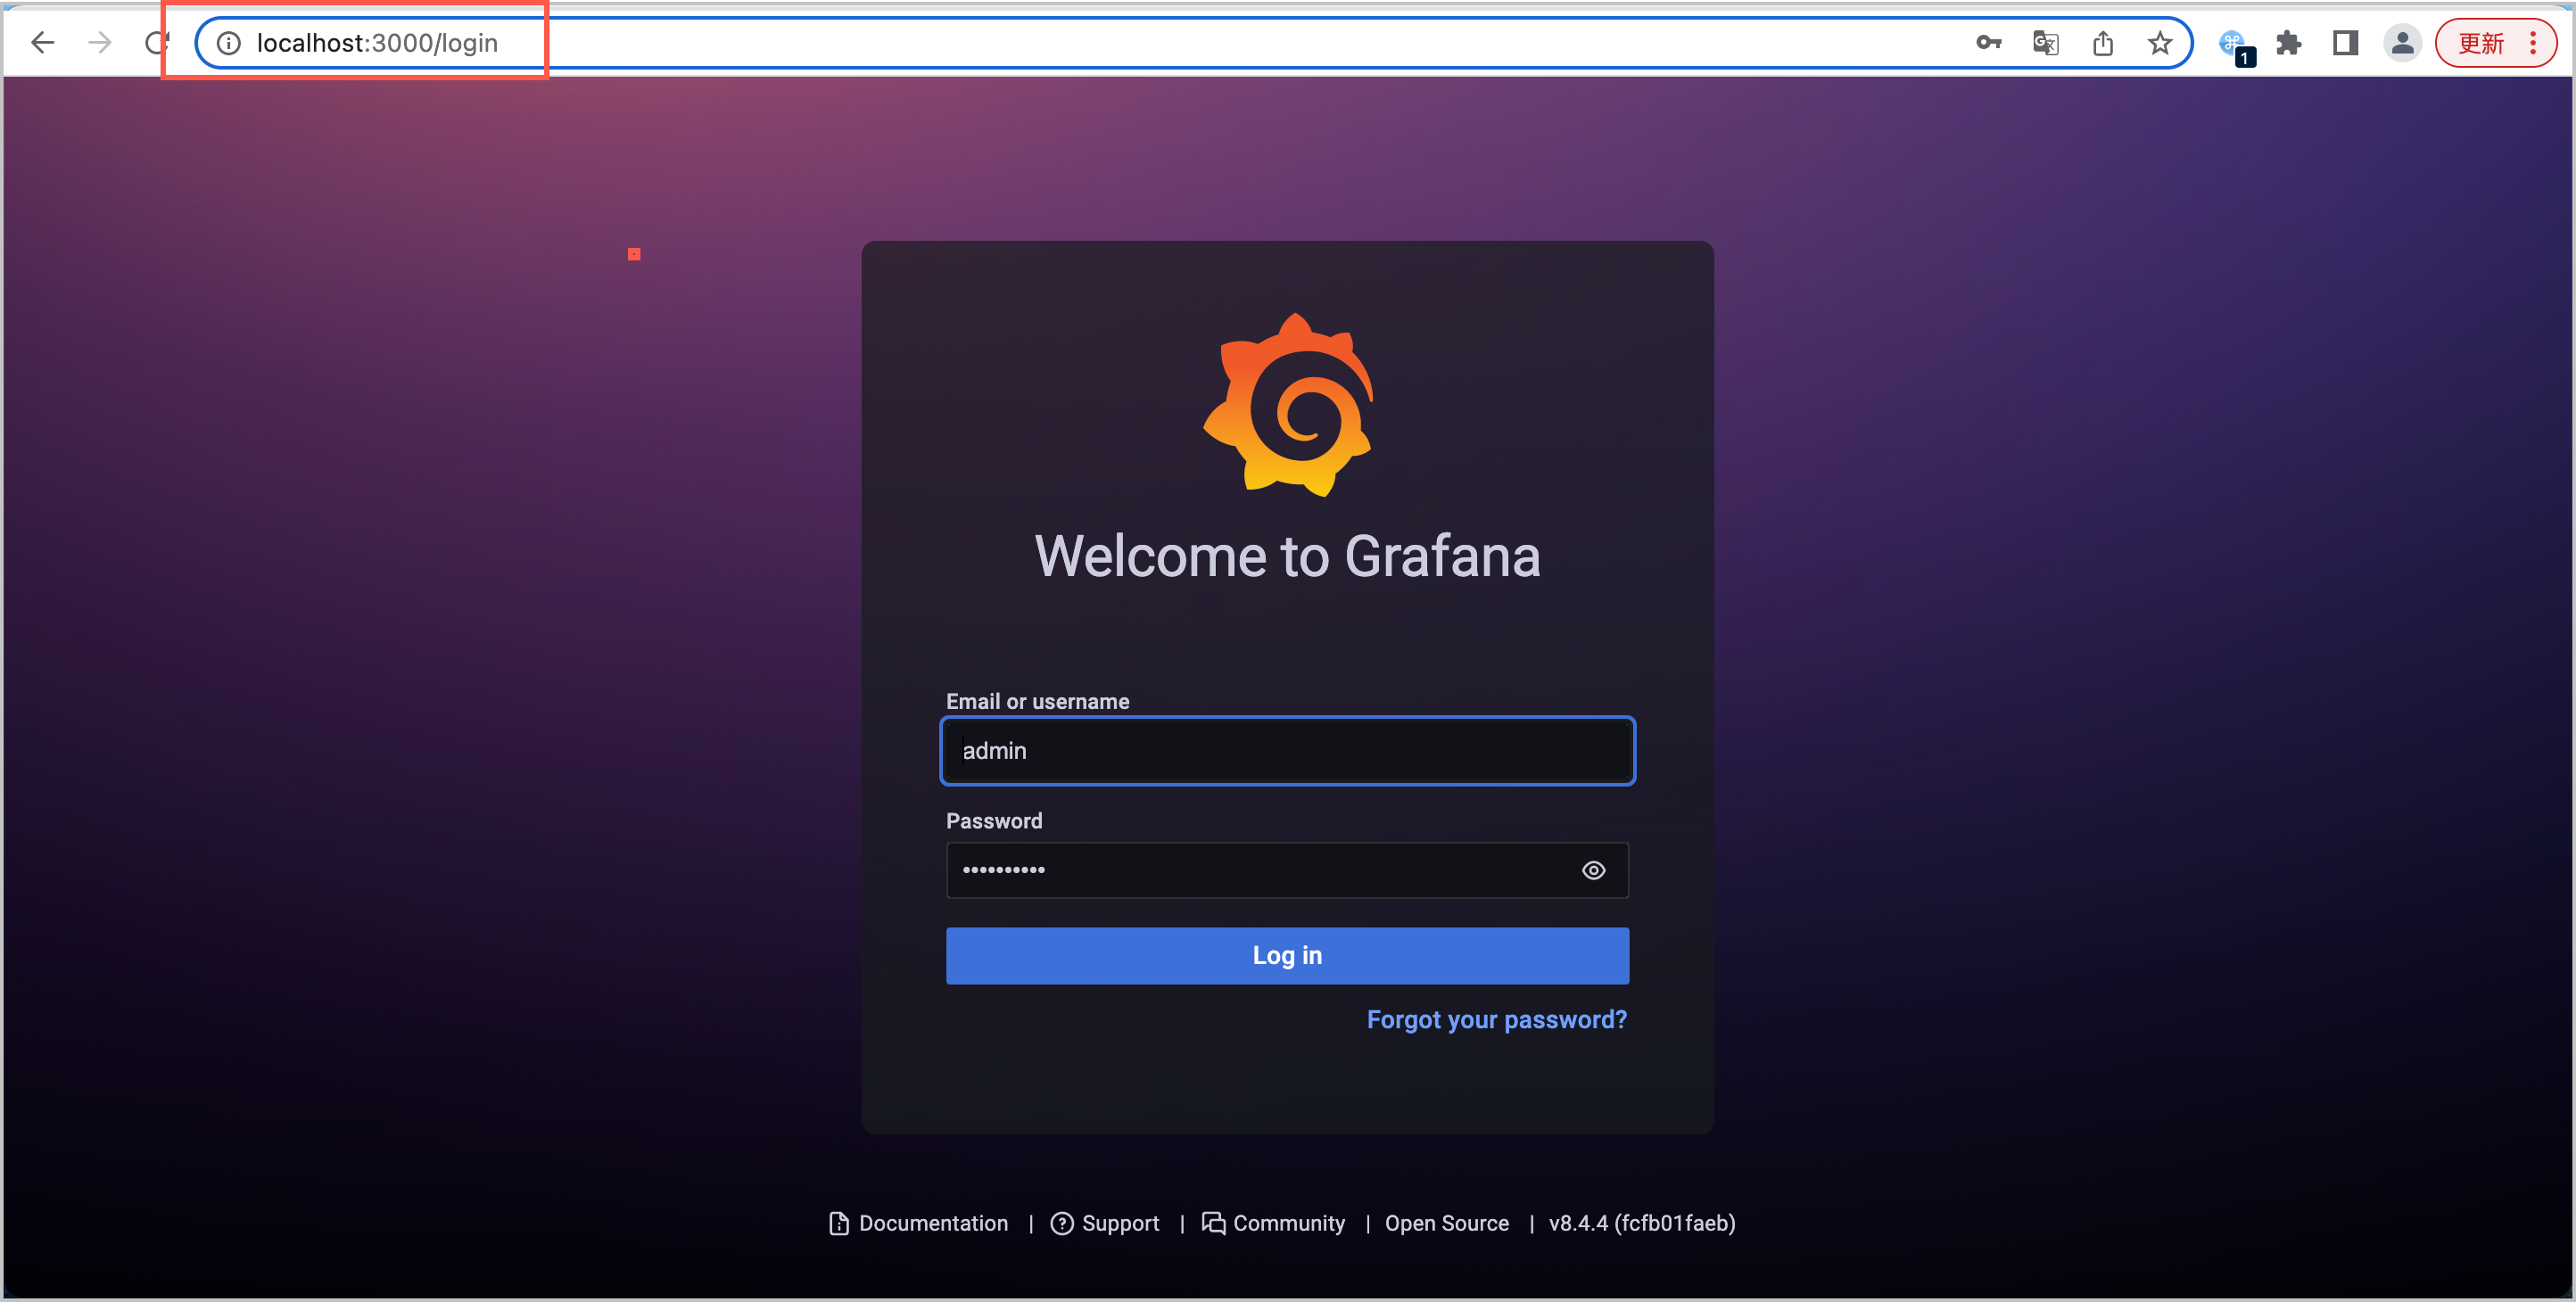
- 进入 Grafana 登录界面,使用用户名和密码登录。
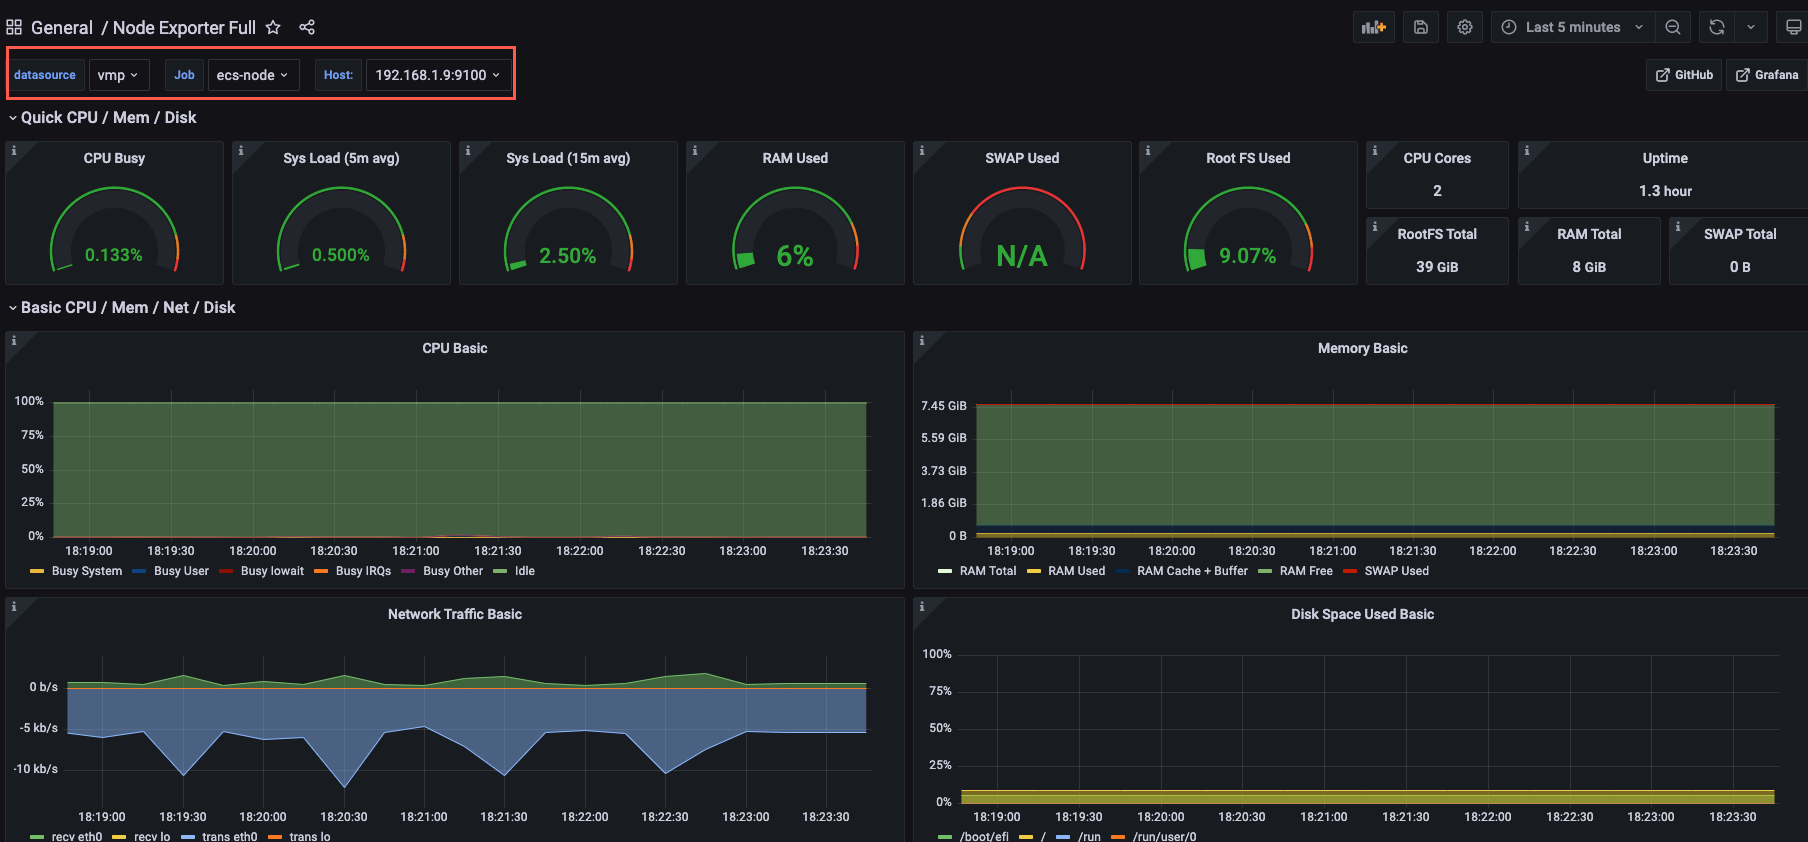
- 登录 Grafana 后,创建 Node 监控大盘,即可查看目标云服务器(ECS)的监控信息。
常见问题
如何查看云服务器的 9100 端口是否被占用
您可以在云服务器实例的控制台中,执行以下命令,检查接口是否被占用。
ss -naltp | grep 9100
返回如下信息时,表示 9100 端口已经被占用。
LISTEN 0 128 [::]:9100 [::]:* users:(("node_exporter",pid=1654,fd=3))
如何修改 node-exporter 的缺省端口
node-exporter 缺省使用 9100 端口对外暴露指标,当云服务器中的 9100 端口被占用时,您可以在启动 node-exporter 时,通过--web.listen-address参数,修改 node-exporter 的指标暴露端口。例如修改为 9200 端口。
nohup ./node_exporter --web.listen-address=":9200"&
最近更新时间:2024.06.06 17:07:56
这个页面对您有帮助吗?
有用
有用
无用
无用