
如何复现skforecast中带间歇重拟合的回测动画?

2026-7-11
问题:复现带间歇重拟合的时间序列回测动画失败
我在Google Colab笔记本中用一维时间序列数据做实验,想复现skforecast包里「带间歇重拟合的回测(Backtesting with intermittent refit)」的动画效果。这个方法是指模型每经过n次预测迭代后重新训练,常用于训练与预测频率不同的场景,支持固定或滚动起点模式。我写了实现代码,但生成的动画和预期不符。
我的实现代码
import numpy as np
import matplotlib.pyplot as plt
from matplotlib.animation import FuncAnimation
from matplotlib.patches import Rectangle
import pandas as pd
from IPython.display import HTML

# create data
df = pd.DataFrame({
    "TS_24hrs": np.arange(0, 274),
    "count"   : np.abs(np.sin(2 * np.pi * np.arange(0, 274) / 7) + np.random.normal(0, 100.1, size=274)) # generate sesonality
})

# Define the initial width for training and test data
TRAIN_WIDTH = 100
TEST_WIDTH = 1

# Define the delay for refitting the model
REFIT_DELAY = 10

# Define the delay for adding test data to train data
ADD_DELAY = 10

# create plot
plt.style.use("ggplot")  # <-- set overall look
fig, ax = plt.subplots( figsize=(10,4))

# plot data
plt.plot(df['TS_24hrs'], df['count'], 'r-', linewidth=0.5,  label='data or y')

# make graph beautiful
plt.plot([], [], 'g-', label="Train", linewidth=8, alpha=0.3) # <-- dummy legend entry
plt.plot([], [], 'b-', label="Test", linewidth=8, alpha=0.3)  # <-- dummy legend entry
plt.xticks([0, 50, 100, 150, 200, 250, df['TS_24hrs'].iloc[-1]], visible=True, rotation="horizontal")
plt.title('Time-series backtesting with intermittent refit')
plt.ylabel('count', fontsize=15)
plt.xlabel('Timestamp [24hrs]', fontsize=15)
plt.grid(True)
plt.legend(loc="upper left")
fig.tight_layout(pad=1.2)


TRAIN_WIDTH = 25
TEST_WIDTH = 10
Y_LIM = 300 #ax.get_ylim()

def init():
    rects = [Rectangle((0, 0), TRAIN_WIDTH, Y_LIM, alpha=0.3, facecolor='green'),
             Rectangle((0 + TRAIN_WIDTH, 0), TEST_WIDTH, Y_LIM, alpha=0.3, facecolor='blue')]
    patches = []
    for rect in rects:
        patches.append(ax.add_patch(rect))
    return patches

# Initialize the start points for training and test data
train_data_start = 0
test_data_start = TRAIN_WIDTH

# Initialize the counter for refitting the model
refit_counter = REFIT_DELAY

# Initialize the counter for adding test data to train data
add_counter = ADD_DELAY

def update(x_start):
    global train_data_start, test_data_start, refit_counter, add_counter, TRAIN_WIDTH

    # Check if the model needs to be refitted
    if refit_counter == REFIT_DELAY:
        # Update the positions of train and test data with refit
        patches[0].xy = (x_start + test_data_start - TRAIN_WIDTH , 0)
        patches[1].xy = (x_start + test_data_start, 0)
        # Reset the counter for refitting the model
        refit_counter = 0
    else:
        # Update the positions of train and test data without refit
        TRAIN_WIDTH += TEST_WIDTH  # Increase the most data width
        patches[0].set_width(TRAIN_WIDTH)
        patches[0].xy = (x_start + test_data_start - TRAIN_WIDTH - 10 , 0)
        patches[1].xy = (x_start + test_data_start, 0)

    # Increase the counter for refitting the model
    refit_counter += 1

    # Check if the test data needs to be added to train data
    if add_counter == ADD_DELAY:
        # Move the training and test data one step forward
        train_data_start += TEST_WIDTH  # Add the width of the test to the widest
        test_data_start += 1
        # Reset the counter for adding test data to train data
        add_counter = 0
    else:
        # Increase the counter for adding test data to train data
        add_counter += 1

    return patches

# Create "Train" and "Test" areas
patches = init()

ani = FuncAnimation(
    fig,
    update,
    frames=np.arange(0, df.shape[0] - TRAIN_WIDTH - TEST_WIDTH),  # All starting points
    interval=70,
    blit=True
)

HTML(ani.to_html5_video())
当前输出
动画保存代码
from matplotlib.animation import FuncAnimation, PillowWriter
ani.save("TLI.gif", dpi=100, writer=PillowWriter(fps=50))
当前动画效果

预期动画效果
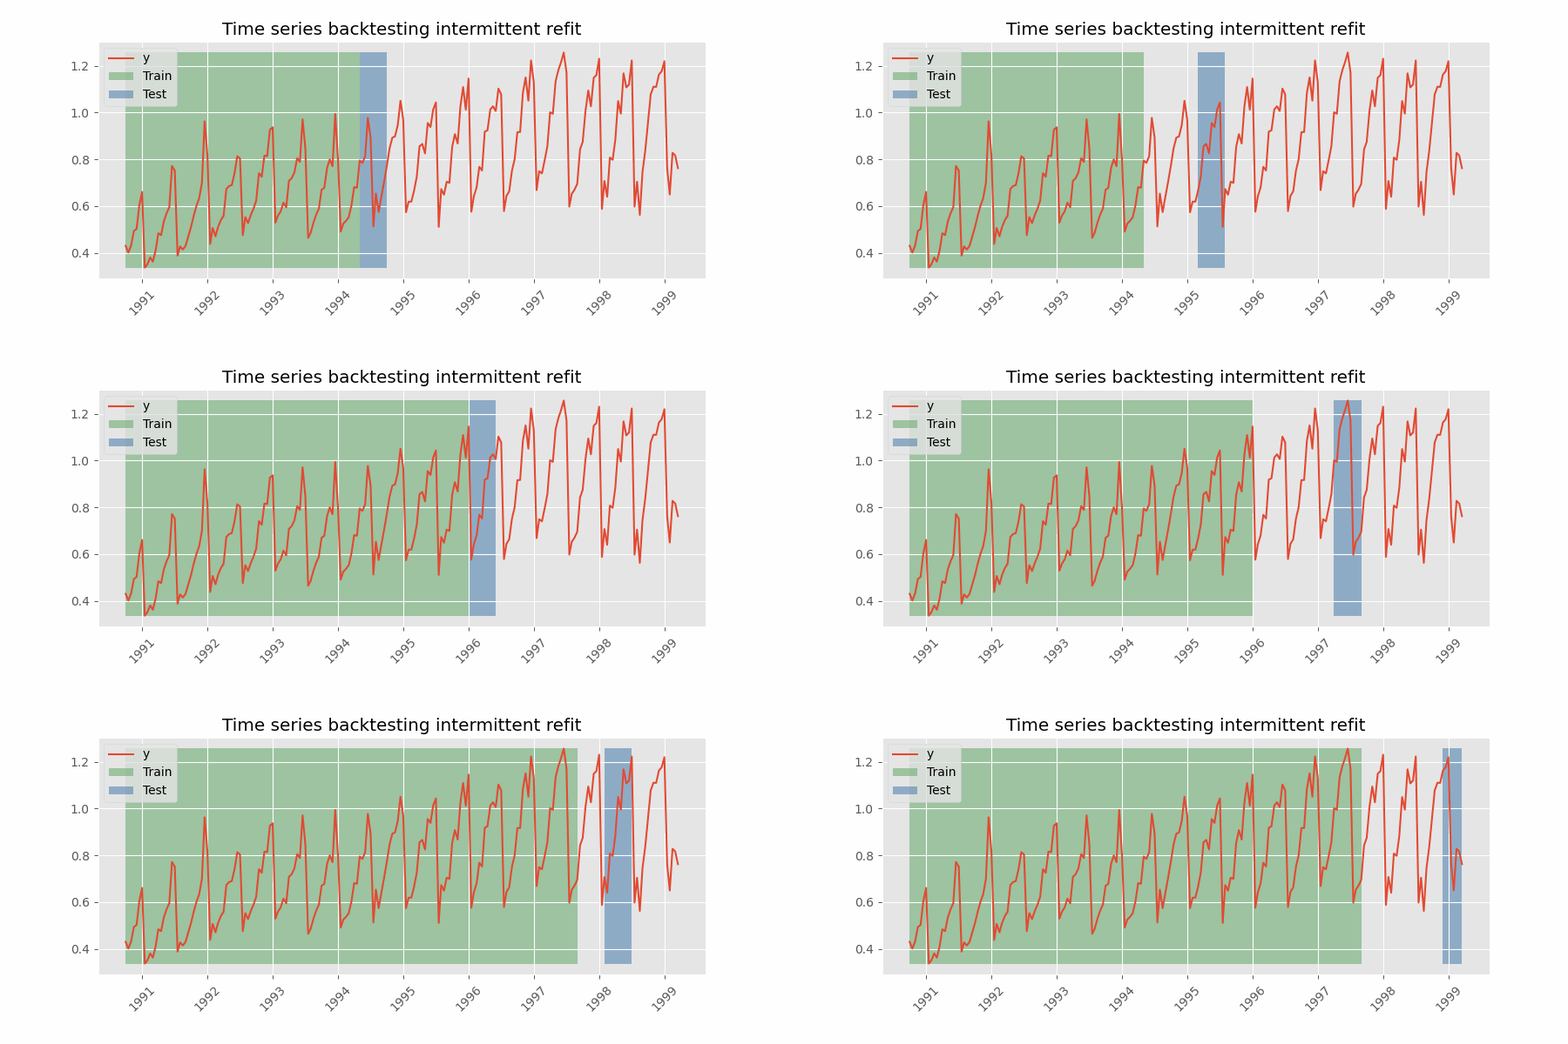
问题分析与修正代码
原代码核心问题是对「间歇重拟合」逻辑理解偏差:训练集宽度和位置更新规则混乱,导致绿色训练块异常拉伸偏移;未正确区分滚动预测阶段(不重拟合,训练集固定宽度,测试块逐步右移)和重拟合阶段(用最新固定宽度数据重新训练,重置块位置)。
修正后的代码:
import numpy as np
import matplotlib.pyplot as plt
from matplotlib.animation import FuncAnimation
from matplotlib.patches import Rectangle
import pandas as pd
from IPython.display import HTML

# 创建时间序列数据
df = pd.DataFrame({
    "TS_24hrs": np.arange(0, 274),
    "count"   : np.abs(np.sin(2 * np.pi * np.arange(0, 274) / 7) + np.random.normal(0, 100.1, size=274))
})

# 配置参数
TRAIN_WIDTH = 25       # 训练集固定宽度
TEST_STEP = 1          # 每次预测步长
REFIT_INTERVAL = 10    # 每10次预测后重拟合一次

# 绘图设置
plt.style.use("ggplot")
fig, ax = plt.subplots(figsize=(10,4))
ax.plot(df['TS_24hrs'], df['count'], 'r-', linewidth=0.5, label='原始数据')

# 图例占位
ax.plot([], [], 'g-', label="训练集", linewidth=8, alpha=0.3)
ax.plot([], [], 'b-', label="测试集", linewidth=8, alpha=0.3)
ax.set_xticks([0, 50, 100, 150, 200, 250, df['TS_24hrs'].iloc[-1]])
ax.set_title('带间歇重拟合的时间序列回测')
ax.set_ylabel('count', fontsize=15)
ax.set_xlabel('时间戳 [24hrs]', fontsize=15)
ax.grid(True)
ax.legend(loc="upper left")
fig.tight_layout(pad=1.2)

Y_LIM = ax.get_ylim()[1]  # 获取y轴上限

def init():
    # 初始化训练和测试块
    train_rect = Rectangle((0, 0), TRAIN_WIDTH, Y_LIM, alpha=0.3, facecolor='green')
    test_rect = Rectangle((TRAIN_WIDTH, 0), TEST_STEP, Y_LIM, alpha=0.3, facecolor='blue')
    patches = [ax.add_patch(train_rect), ax.add_patch(test_rect)]
    return patches

# 全局状态变量
current_pos = TRAIN_WIDTH  # 当前测试块起始位置
predict_count = 0          # 已完成预测次数

def update(frame):
    global current_pos, predict_count

    # 每REFIT_INTERVAL次预测后触发重拟合
    if predict_count == REFIT_INTERVAL:
        # 训练块跳转到最新固定宽度位置
        patches[0].set_x(current_pos - TRAIN_WIDTH)
        # 测试块回到训练块右侧
        patches[1].set_x(current_pos)
        predict_count = 0
    else:
        # 滚动预测:训练块和测试块同步右移1步
        patches[0].set_x(patches[0].get_x() + TEST_STEP)
        patches[1].set_x(patches[1].get_x() + TEST_STEP)
        predict_count += 1

    current_pos += TEST_STEP
    return patches

patches = init()

# 计算总帧数
total_frames = len(df) - TRAIN_WIDTH - 1
ani = FuncAnimation(
    fig,
    update,
    frames=total_frames,
    interval=70,
    blit=True
)

HTML(ani.to_html5_video())
修正逻辑说明
- 固定训练集宽度:全程保持
TRAIN_WIDTH不变,符合间歇重拟合核心逻辑(每次重拟合用最新固定宽度数据) - 滚动预测阶段:每次迭代训练块和测试块同步右移1步,模拟测试数据逐步纳入训练范围的过程
- 重拟合触发:每完成
REFIT_INTERVAL次预测,训练块直接跳转到最新固定宽度位置,测试块重置到训练块右侧,模拟重新训练后的起始状态
内容的提问来源于stack exchange,提问作者Mario
相关产品推荐
相关产品推荐


